Centre For Local Research into Public Space (CELOS)


 Show search options


 You are on the [PFR Budgetary Trends 1991-2007] page of folder [Analysis]
 For the cover page of this folder go to the
 posted October 16, 2007
Report on Toronto Parks and Recreation Operating Budget Trends 1991-2007
By Daniel Cayley, April 2007
(graphs adapted by Corey Chivers)
Introduction:
The purpose of this report is to explore the trends in expenditure, revenue, and staffing of the City of Torontos Parks and Recreation Department (now called Parks, Forestry and Recreation) for the years 1991 through 2007. This involves comparing the former boroughs of the city from 1991 to 1997 and the amalgamated City of Toronto from 1998 to 2006.
Due to differences in record-keeping, some data is unavailable and inconsistent. The appendix to the report contains all source data.
For expenditure tracking gross expenditure is used. Net expenditure is listed in the appendix where available but is not used for pre/post amalgamation comparison because full revenue data for the six boroughs (Toronto, Scarborough, Etobicoke, York, East York, North York) is either incomplete or in some cases not listed at all.
Revenue data is budgeted rather than actual, as complete actual revenue figures are not listed. Complete revenue data (forecasted) is only available since amalgamation, so trends in revenue are only explored between 1998 and 2007. Actual revenue, where available, is listed in the appendix, but is not used for pre/post amalgamation comparison.
Trends in staffing are tracked through FTEs (full time equivalents), but only since amalgamation, due to the lack of complete pre-amalgamation staffing data for the boroughs.
In the first three sections, the data, and related graphs and percentages, are presented separately covering expenditure, revenue, and staffing. These first three sections will serve principally to present the pure data with a minimum of analysis. Following this, in the fourth section, the data from the first three sections is presented together in comparison and analyzed. An appendix follows the final section showing all source data.
Expenditure:
As stated in the introduction, budgeted gross expenditure is used to map trends over the last fifteen years. While actual expenditure data would have been more accurate as a measure, complete data is unavailable. However, a comparison of budgeted and actual expenditure, where data is available for both, shows that the difference between the two is quite small. Therefore budgeted expenditure is adequate in showing trends in expenditure.
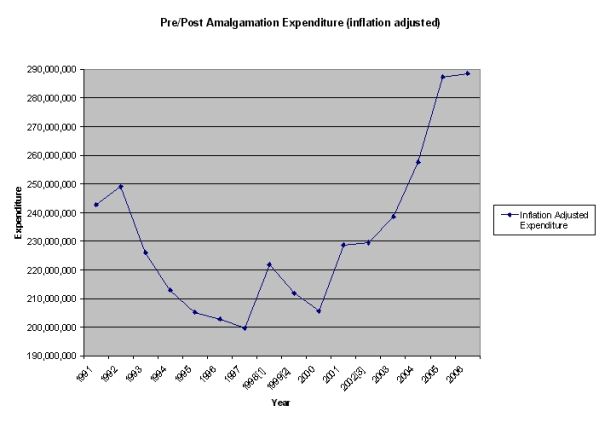
Following is the numerical representation of Parks and Recreation expenditure over the last fifteen years, with real data (that is, adjusted for the effects of inflation). All data is taken from the budget of the year in question unless otherwise delineated:
Pre-Amalgamation Parks and Recreation Proposed Gross Expenditure
|
Year |
Budgeted Expenditure |
Adjusted for Inflation |
|
1991 |
181,001,487 |
242,711,478 |
|
1992 |
187,755,760 |
249,077,416 |
|
1993 |
173,426,019 |
226,040,681 |
|
1994 |
163,499,730 |
212,854,544 |
|
1995 |
161,142,623 |
205,240,946 |
|
1996 |
161,606,515 |
202,825,255 |
|
1997 |
161,989,671 |
199,715,742 |
Post-Amalgamation Parks Forestry and Recreation Proposed Gross Expenditure
|
Year |
Budgeted Expenditure |
Adjusted for Inflation |
|
1998 |
181,556,100 |
221,879,829 |
|
1999 |
176,994,700 |
211,900,407 |
|
2000 |
176,115,100 |
205,559,631 |
|
2001 |
201,475,500 |
228,707,453 |
|
2002 |
207,294,000 |
229,482,059 |
|
2003 |
219,745,600 |
238,538,227 |
|
2004 |
241,586,000 |
257,491,948 |
|
2005 |
276,580,500 |
287,386,436 |
|
2006 |
283,643,400 |
288,551,619 |
This table shows two main trends. First, prior to amalgamation there is a consistent decrease in expenditure for the combined boroughs from year to year. Second, after amalgamation, following the initial jump and then reduction in expenditures related to the amalgamation process, there is a constant increase in expenditure beginning in 2001. Treated together a downward trend preceding amalgamation is seen followed by an upward trend once the effects of amalgamation are discounted. As seen below, a graphic representation clearly shows these two separate trends, as well as, the extraneous period around amalgamation in 1997-1999 range:
Revenue:
Exploring the revenue trend in pre/post amalgamation revenue is impossible due to the lack of data in the budgets in the separate boroughs between 1991 and 1997. For this reason revenue trends will only be examined between 1998 and 2006. Also, since actual revenue data for the amalgamated city is not complete, budgeted revenue is used. As with expenditure a comparison of forecasted and actual revenue shows that the difference between the two is often small and that the trends of both are similar. Therefore it is reasonable to use budgeted revenue as a competent measure of revenue trends. A numerical presentation of the revenue data, both nominal and adjusted for inflation, follows:
Post-Amalgamation Parks Forestry and Recreation Forecasted Revenue
|
Year |
Budgeted Revenue |
Inflation Adjusted |
|
1998 |
58,152,800 |
71,068,575 |
|
1999 |
60,327,700 |
72,225,124 |
|
2000 |
58,238,200 |
67,974,994 |
|
2001 |
63,057,600 |
71,580,629 |
|
2002 |
66,982,000 |
74,151,530 |
|
2003 |
69,343,000 |
75,273,208 |
|
2004 |
78,823,200 |
84,012,895 |
|
2005 |
73,072,500 |
75,927,426 |
|
2006 |
71,957,200 |
73,202,361 |
Unlike expenditure, the trend in revenue is not so clear. Using real revenue as a more reliable marker (i.e. discounting the possible misleading effects of inflation) several fluctuation are evident, but no clear trend up or down can be seen. A graphic representation more clearly shows a trend of variance around a fairly steady level of revenue:
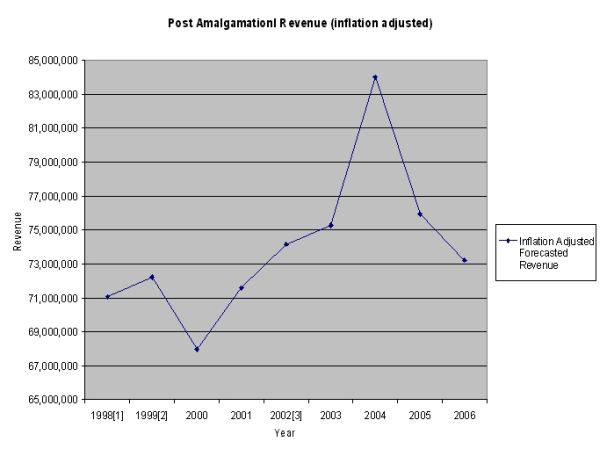
Looking at the graph of revenue over time a very slight trend toward increase can be seen. This having been said, this trend is extremely slight over the tracking period and the sometimes large fluctuations overshadow the trend. A single sentence description of the trend is that revenue is fluctuating around a slowly increasing median.
Staffing:
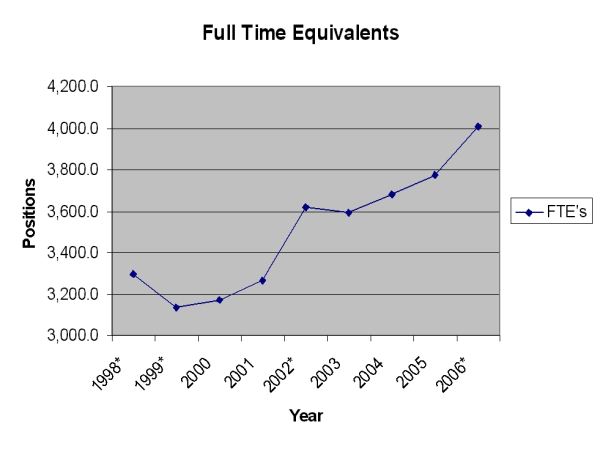
The trend in staffing from 1998 to 2006 in the number of positions (FTEs) in Parks and Recreation has been towards an increase. There was a slight decrease following amalgamation and an anomalous decrease in 2003, but otherwise the number of positions has increased every year. The trend is especially evident in the 2004-2006 range when positions increased by over 400. The data showing this trend on FTEs is shown below, both graphically and numerically:
Parks Forestry and Recreation FTE's by Year
|
Year |
FTE's |
References |
|
1998 |
3,294.0 | |
|
1999* |
3,133.0 | |
|
2000 |
3,169.0 | |
|
2001 |
3,262.4 |
reference (pdf, p.105) |
|
2002 |
3,619.5 | |
|
2003 |
3,592.7 | |
|
2004 |
3,682.2 | |
|
2005 |
3,771.7 |
reference 1 |
|
2006 |
4,005.8 | |
|
2007 |
4,122.3 |
reference table 1, page 3 |
Analysis:
In the preceding three sections, trends have been outlined in expenditure, revenue and staffing for Parks and Recreation. In this section the three will be treated together, along with population changes to highlight the variations in these variables over the time. The complete data used in this section can be found in the appendix. Following is a table illustrating the earlier data for expenditure and revenue with the addition of net expenditure figures since amalgamation:
Pre/Post-Amalgamation Real Comparison
|
Year | Inflation Adjusted Budgeted Expenditure | Inflation Adjusted Budgeted Revenue | Net Expenditure |
|
1991 |
242,711,478 | ||
|
1992 |
249,077,416 | ||
|
1993 |
226,040,681 | ||
|
1994 |
212,854,544 | ||
|
1995 |
205,240,946 | ||
|
1996 |
202,825,255 | ||
|
1997 |
236,788,589 |
75,631,380 |
161,157,209 |
|
1998 |
221,879,829 |
71,068,575 |
150,811,254 |
|
1999 |
211,900,407 |
72,225,124 |
139,675,283 |
|
2000 |
205,559,631 |
67,974,994 |
137,584,637 |
|
2001 |
228,707,453 |
71,580,629 |
157,126,823 |
|
2002 |
229,482,059 |
74,151,530 |
155,330,529 |
|
2003 |
238,538,227 |
75,273,208 |
163,265,019 |
|
2004 |
257,491,948 |
84,012,895 |
173,479,053 |
|
2005 |
287,386,436 |
75,927,426 |
211,459,010 |
|
2006 |
288,551,619 |
73,202,361 |
215,349,258 |
The data for net expenditure shows the same trend as gross expenditure, being a decrease immediately proceeding amalgamation followed by a consistent and marked increase thereafter up to 2006.
The percentage change in all key variables (expenditure, revenue, net expenditure, FTEs and population) from year to year between 1998 and 2006 are fairly consistent in direction, but not in terms of magnitude. Beside the fluctuations in revenue, the trend of decreases immediately following amalgamation followed by increases in all variables in the period from 2001 to 2006 is shown in the data. There are several anomalies from this trend. Most important are the decreases in revenue in 2005 and 2006, as well as the decrease in population in 2006. However, all in all the trends discussed in earlier sections hold up for all variables. This data is presented in the following graph:
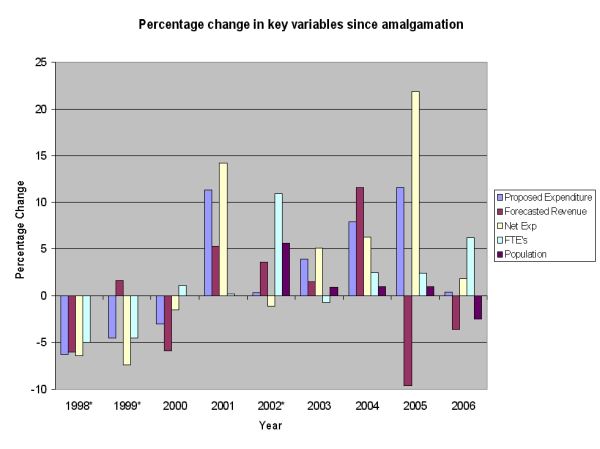
This data, viewed as a whole, points out two important facts about Parks and Recreation spending. First, real (inflation-adjusted) net expenditure and staffing have increased significantly in recent years. And second, the population during that period has increased at a far slower rate.
The inconsistencies between population growth and spending/staffing increases are best shown by looking at the percentage change in these variables over time. The following graphical representation shows the changes in the key variables from 1997 to 2001 and 1997 to 2006 :
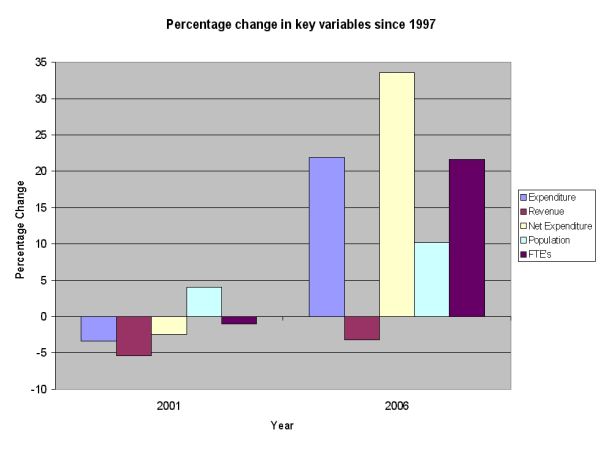
The changes from 1997 to 2001 show a decrease in all variables while population increases at roughly 4%. When the percentage change from 1997 to 2007 is examined, with only a 10% increase in population, net expenditure increased over 30%, due to a large increase in real (inflation-adjusted) expenditure without a matching increase in revenue, with a staff increase of over 20%.
Appendix:
The appendix is attached here as a pdf: Appendix